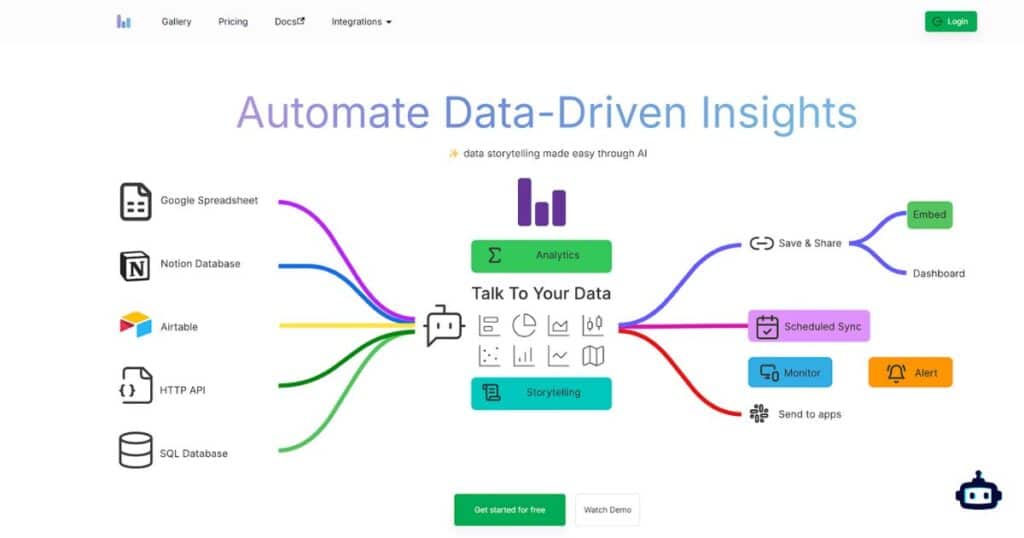
Columns AI is a tool designed to turn your overwhelming data streams into engaging, insightful stories. In this guide, we’ll explore how Columns AI can revolutionize your data storytelling, making it both effective and fun. So grab a coffee, sit back, and let’s dive into the world of Columns.AI.
What is Columns AI?
Columns AI is a cutting-edge platform that simplifies the process of transforming raw data into visually compelling narratives. Whether you’re a marketer, a data analyst, or just someone who loves playing with data, Columns.AI can make your life easier.
Key Features
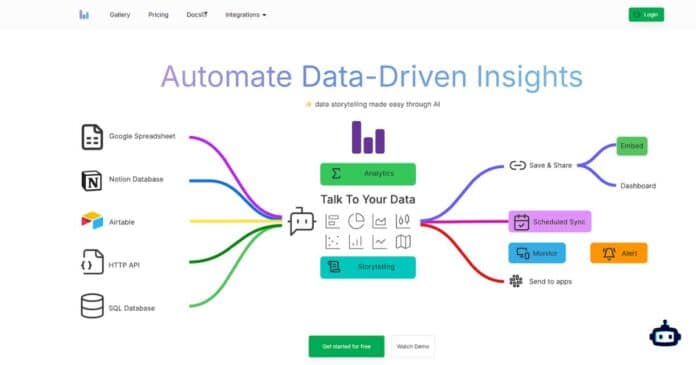
- Data Integration: Connect various data sources like spreadsheets, CSV files, Notion, Airtable, and SQL databases effortlessly.
- Visualization Tools: Utilize AI-powered auto visual recommendations and customizable charts with a user-friendly drag-and-drop interface.
- Storytelling Enhancements: Add annotations, images, icons, and shapes to highlight key metrics and provide context.
- Collaboration: Integrate with tools like Slack for seamless teamwork.
- Automation: Keep your data stories updated automatically with real-time data synchronization.
Benefits of Using Columns AI
Using Columns AI isn’t just about making pretty charts—it’s about telling stories that resonate and drive action. Here’s how it can benefit you:
| Feature | Benefit |
| Efficiency | Streamlines the data storytelling process, saving time and effort. |
| User-Friendly Interface | Intuitive design makes it easy to use, even for beginners. |
| Integration Capabilities | Connect multiple data sources effortlessly. |
| Collaboration Tools | Enhance teamwork and streamline project workflows. |
| Customization and Automation | Tailor your visual stories and keep them up-to-date automatically. |
How to Get Started with Columns AI
Starting with Columns AI is a breeze. Here’s a quick guide:
Sign-Up Process
- Visit the Columns AI website and sign up for an account.
- Choose the plan that suits your needs (Free, Premium, or Business).
- Follow the onboarding steps to set up your profile.
Setting Up Data Sources
- Go to the data sources section.
- Connect your preferred data sources (e.g., Google Sheets, Notion).
- Import your data and start organizing it within ColumnsAI.
Creating Your First Data Story
- Select a dataset from your connected sources.
- Use the drag-and-drop interface to create your visualizations.
- Add annotations, images, and other storytelling elements.
- Share your visual story with your team or export it as needed.
Advanced Features of Columns AI
For those ready to take their data storytelling to the next level, ColumnsAI offers advanced features:
AI-Powered Visual Recommendations
Columns AI suggests the best visualizations based on your data, ensuring you always present the most relevant insights.
Customizable Charts and Visuals
Tailor your charts and visuals to match your brand and style, making your data stories uniquely yours.
Interactive Dashboards
Create interactive dashboards that allow viewers to explore the data in real-time, providing a dynamic experience.
Annotations and Highlights
Add context to your data stories with annotations and highlights, making sure your audience understands the key points.
Real-World Use Cases
Columns AI isn’t just for data geeks. It’s a versatile tool that benefits various industries:
| Industry | Application |
| Marketing | Visualize campaign performance and consumer trends. |
| Finance | Present complex financial data in an easily digestible format. |
| Education | Create interactive learning materials. |
| Healthcare | Visualize patient data trends. |
| IT & Development | Track project progress and analytics. |
| Retail | Analyze customer behavior and sales trends. |
| Real Estate | Present market analyses visually. |
| Non-Profits | Communicate impact more effectively. |
| HR | Visualize employee data and performance metrics. |
| Research | Present findings in a more engaging manner. |
Comparing Columns AI with Other Data Storytelling Tools
Columns AI stands out in the crowded field of data storytelling tools. Let’s see how it compares to some of the big players:
| Tool | Comparison |
| Tableau | Columns AI is more user-friendly and less complex, perfect for users who need simplicity. |
| Power BI | While Power BI offers advanced analytics, Columns AI excels in visual storytelling. |
| Other Tools | Columns AI combines ease of use with powerful features, making it a great all-rounder. |
Pricing and Plans
Columns AI offers a variety of plans to suit different needs:
| Plan | Price (USD/month) | Features |
| Free | $0 | AI-assisted data storytelling, unlimited data connections, 10 visual stories. |
| Premium | $15 | Unlimited visual stories, API access, unlimited time series data forecasting. |
| Business | Custom | SSO/SAML integration, team management, white-label customization. |
Tips and Best Practices for Using Columns AI
To get the most out of Columns.AI, here are some tips and best practices:
Optimizing Data Visualization
- Choose the right type of visualization for your data.
- Keep it simple and avoid clutter.
- Use colors strategically to highlight important information.
Effective Storytelling Techniques
- Focus on a clear narrative.
- Highlight key metrics and trends.
- Use annotations to provide context.
Collaboration Tips
- Share your visual stories with your team regularly.
- Use collaboration features to gather feedback and make improvements.
- Automate updates to keep everyone on the same page.
Conclusion
Columns.AI is a total game changer for anyone who wants to turn data into stories. It’s so easy to use, so powerful and integrates so well it’s a must have for data lovers. Ready to turn your data into stories? Try Columns AI today and see for yourself.
For more data storytelling tips check out our other articles on Tipfuly. GoCharlie AI: Content Creation Features. Visit the Columns.AI Support Page for help and join the community forum to connect with others. More on data visualization and storytelling.
By understanding and utilizing Columns AI, you can turn raw data into meaningful stories that inform, engage, and resonate with your audience. Happy storytelling!

